Live inventory replacing pivot tables

Real-time inventory and operations tracking for a busy laundromat.

Read the case studyA private internal tool the laundromat runs on today. No live link or code to share, since client work stays private.
Real-time inventory and operations tracking for a busy laundromat.

The problem

01 / 04

Stockouts and overordering

Supplies were counted by hand. Detergent could run out mid-shift while other items got ordered twice.

Laundry operationsBefore · spreadsheets

Supply count · by hand

Reorder point
DetergentOut mid-shift
Fabric softenerOrdered twice
Laundry bagsRunning low

No alert fires when stock drops below the line.

0stock alerts
0cycle view
1manual count
02 / 04

No view of machine cycles

Nobody could see how many cycles each washer and dryer ran, so throughput was guesswork.

Laundry operationsBefore · spreadsheets
Washer 1?cycles
Washer 2?cycles
Washer 3?cycles
Dryer 1?cycles
Dryer 2?cycles
Dryer 3?cycles
0stock alerts
0cycle view
1manual count
03 / 04

Scattered spreadsheets

Inventory and revenue lived in separate spreadsheets, stitched together with pivot tables.

Laundry operationsBefore · spreadsheets
Supplies.xlsx

Counted weekly

Sales.xlsx

Typed in daily

Pivot_Summary.xlsx
#REF!

Refresh before reading

0stock alerts
0cycle view
1manual count

04 / 04

Nothing in one place

Supplies, cycles, revenue and staff were never in one view. Every answer meant checking several places.

Laundry operationsBefore · spreadsheets
Supplies

Manual count

No alerts

Cycles

Not logged

No throughput

Revenue

Separate sheet

No daily view

Staff

Separate sheet

Not linked

0stock alerts
0cycle view
1manual count

What I built

Three things it does really well.

A full-stack management dashboard centered on real-time inventory and operations — covering supply levels, laundry cycles, customers, payroll, and revenue. Owners get live stock alerts, throughput visibility, and unified reporting in one place.

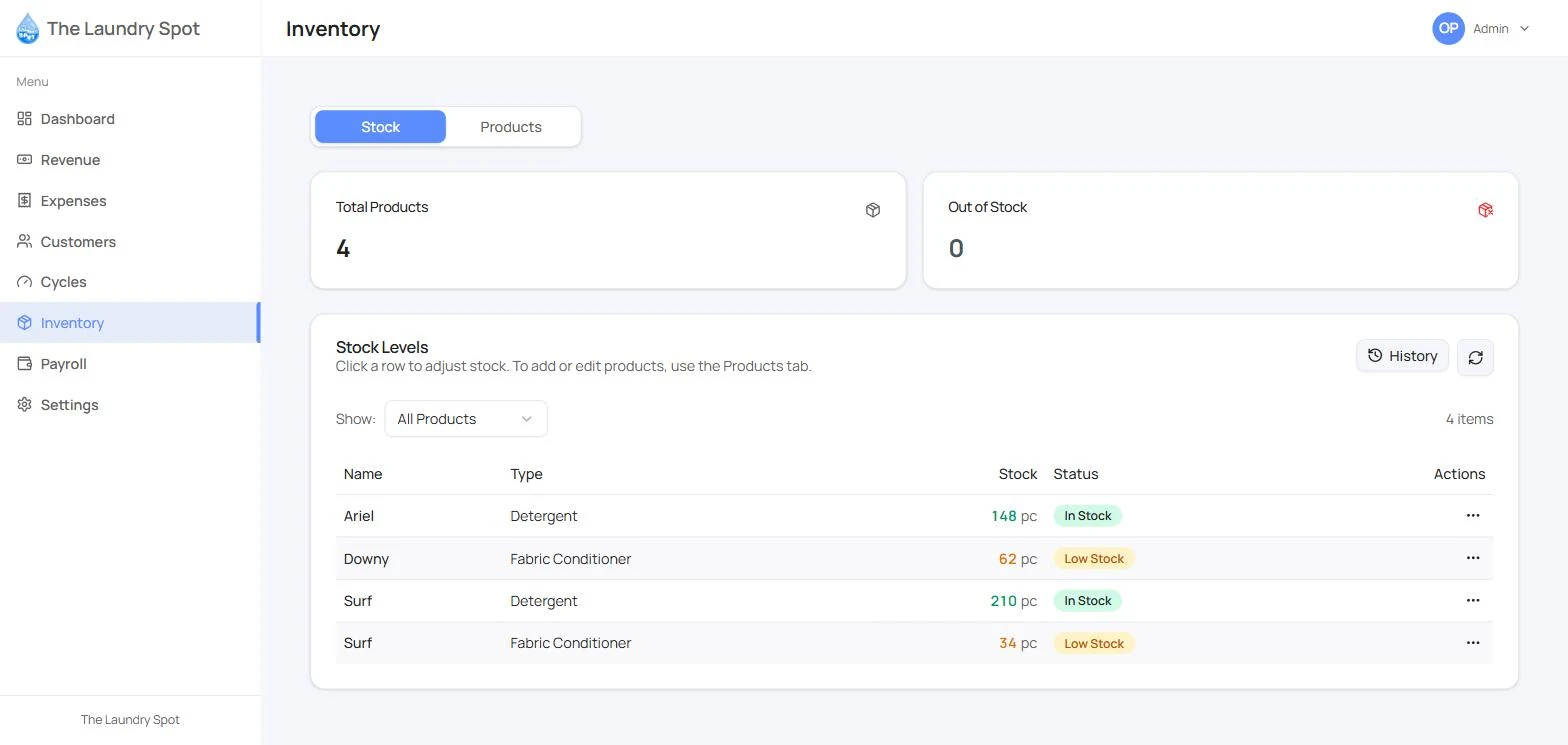
Inventory

Stock that warns you first

Live supply levels with a threshold per item, so low stock gets flagged before it runs out.

  • Low-stock and out-of-stock alerts
  • Usage logs for detergent, softener and packaging
The Laundry Spot — Stock that warns you first
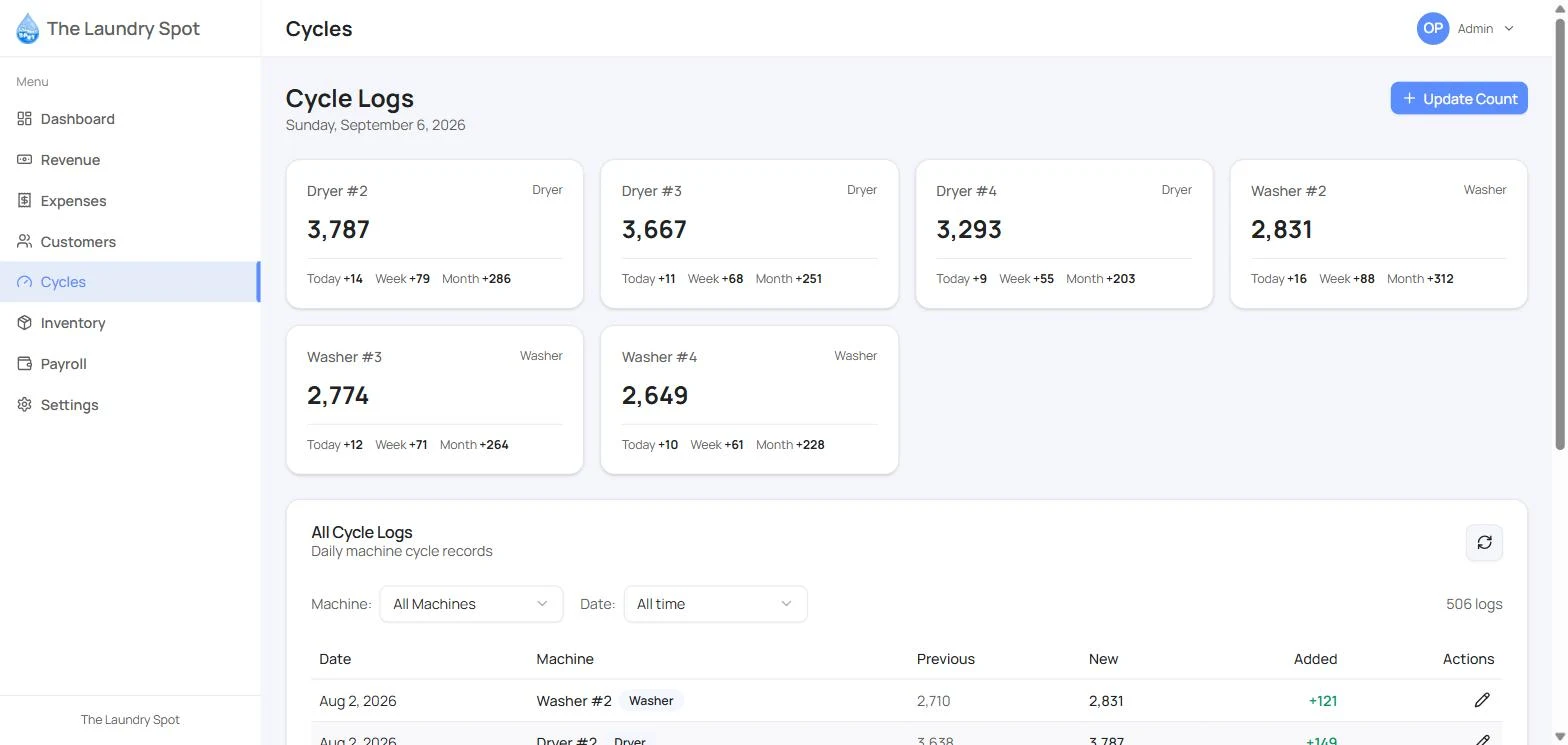
Operations

Every machine cycle counted

Cycle counts per machine, tied to customer orders.

  • Daily, weekly and monthly deltas
  • Throughput visible at a glance
The Laundry Spot — Every machine cycle counted
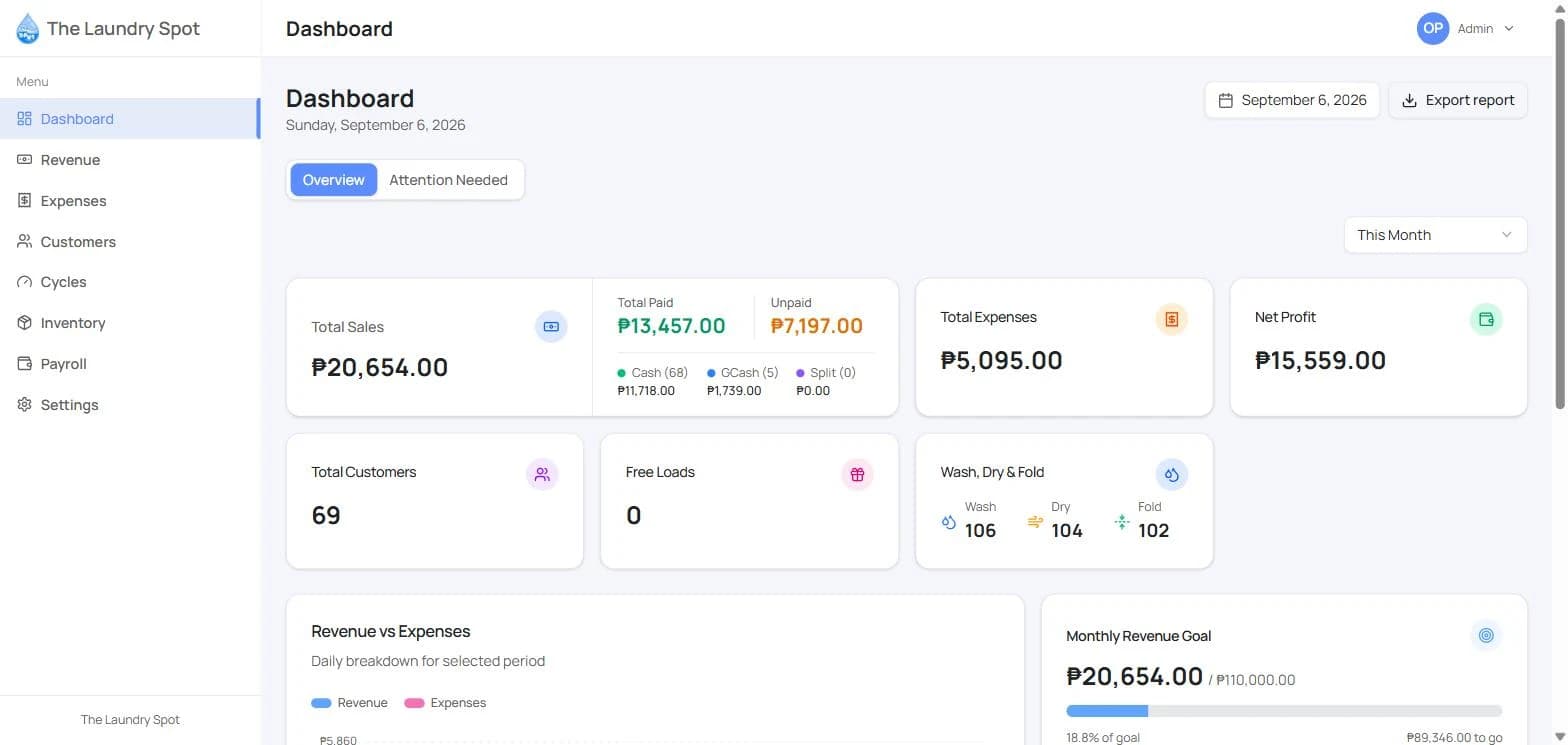
Overview

One dashboard, no pivot tables

Revenue, expenses, payroll and customers in one place.

  • Sales, payment split and net profit
  • Payroll computed from the owner's existing rules
The Laundry Spot — One dashboard, no pivot tables

Gallery

Overview dashboard — sales, payment split, expenses, net profit
Revenue entries by service, payment type and order status
Live stock levels with low-stock and out-of-stock alerts
Per-machine cycle counts with daily, weekly and monthly deltas
Customer records with contact details and service notes

Tech stack used

Built with Next.js, TypeScript, Tailwind CSS, and Supabase.

Working on something similar?

Let's build
yours next.

Start a projectStart a project

Get in touch

Let's build something.

I take on a small number of collaborations each quarter. Tell me what you're building and I'll get back within 24 hours.